
Executive Overview
Sales, GM%, basket size, store ranking, and trendlines.
- Sales
- GM%
- Basket size
- Store ranking
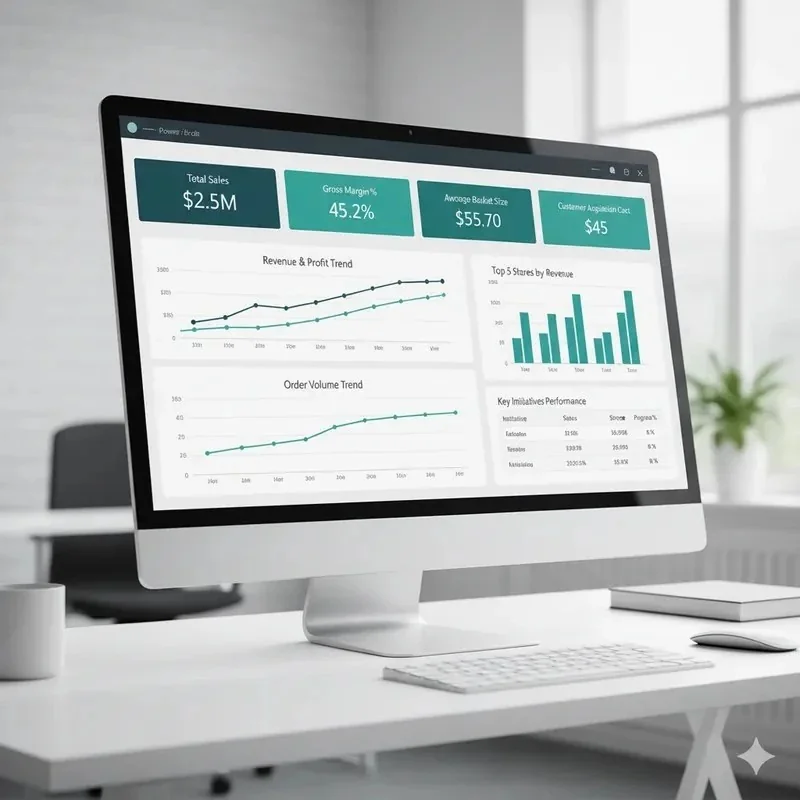
Bring POS, e-commerce, and marketing into one model. Track margin and sell-through in real time, forecast demand, and launch data-backed promotions that actually move stock.
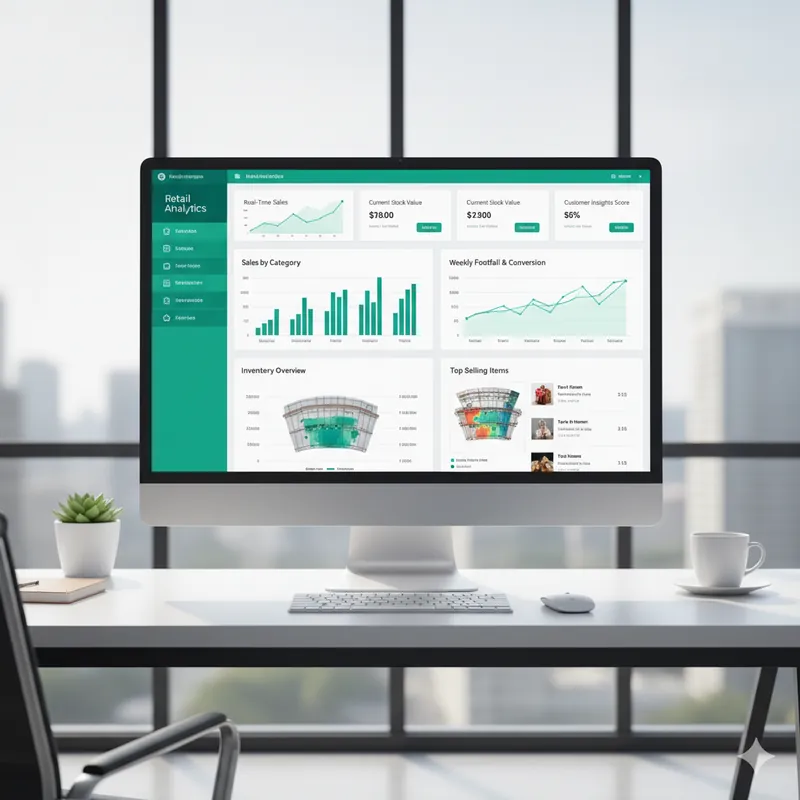
Our retail management solution of choice is an all-in-one system that extends Microsoft Dynamics 365 Business Central with the industry-specific functionality of LS Retail's LS Central to provide one single platform for financials, POS, store operations, supply chain, inventory, e-commerce, and loyalty.
Replace fragmented tools with one single source of truth. Stop searching across disjointed databases and eliminate repeat entry.
See business performance at a glance. Act instantly to cut costs, grow revenue, and identify high-value opportunities.
Understand your customers better. Use data-backed insights to drive retention and improve customer lifetime value.
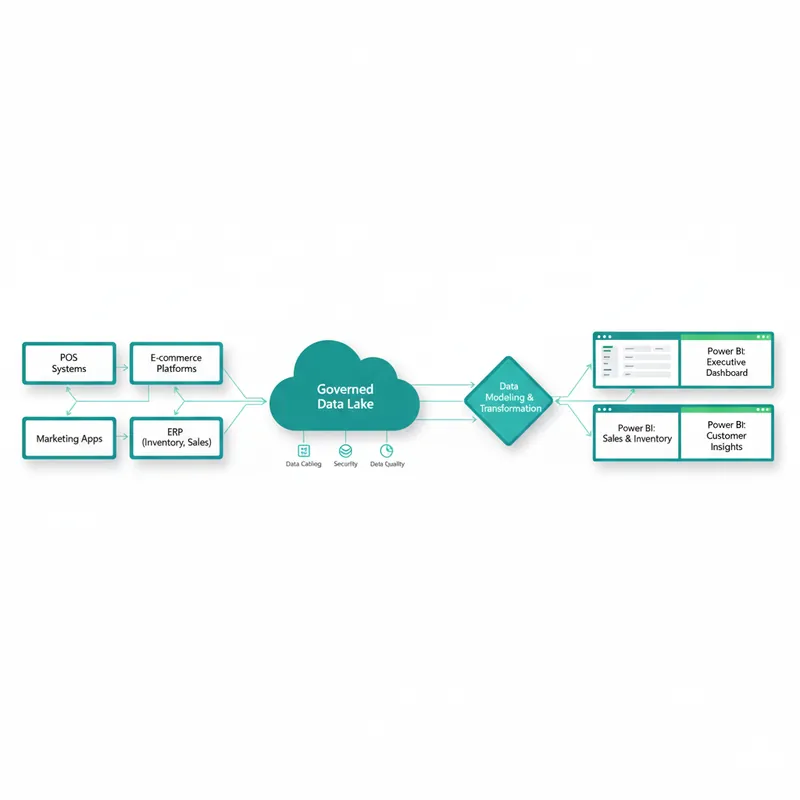
Four steps from raw, scattered data to decisions your team acts on daily.
All sources — Shopify/Shopcada, POS, ERP, ads, CRM — into a governed lake with unified SKUs, stores, and calendars.
Star schema (Sales, Inventory, Customer, Product, Store) with conformed dimensions, incremental refresh, RLS, and data-quality checks.
Role-based dashboards (Exec, Merch, Store Ops, Marketing) with drillthrough, mobile views, and field parameters.
Alerts (low stock, margin erosion, promo uplift), reorder triggers, and export/sync to your tools.
Prebuilt pages tailored to common retail decisions.
Sales, GM%, basket size, store ranking, and trendlines.
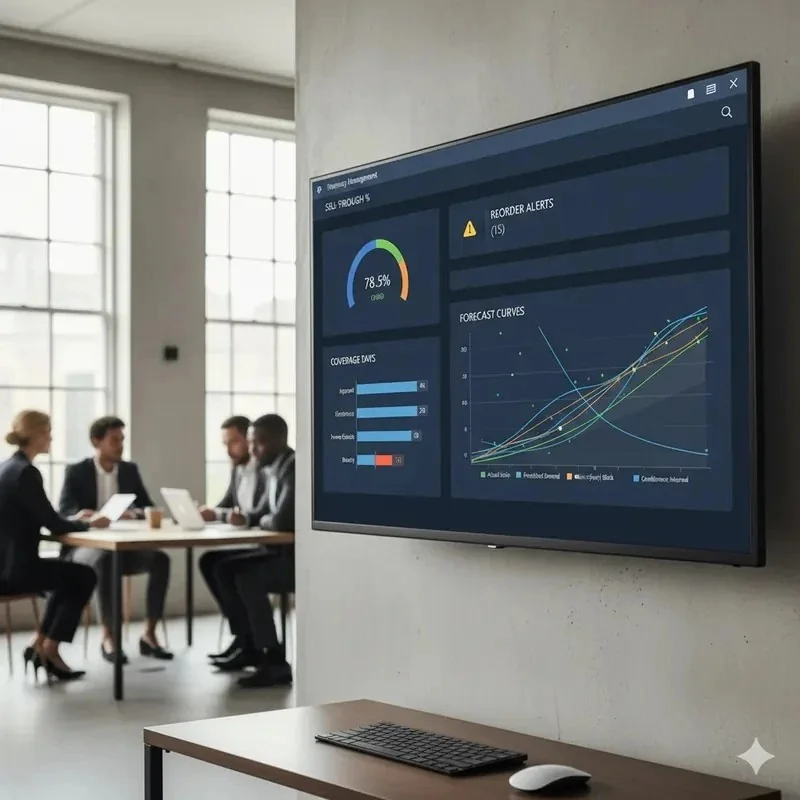
Sell-through, coverage days, reorder alerts, and forecast.
Cohorts, CLV, repeat rate, and promo effectiveness.

8,000+ SKUs across necklaces, rings, earrings, bracelets.
From e-commerce, POS, ERP into one model.
On sales, profit, ratings to surface winners.
Via coverage and sell-through alerts.
Using uplift attribution and basket analysis.
Shopify/Shopcada, POS, ERP, CRM, ads platforms, spreadsheets, and databases via connectors/APIs.
Baseline dashboards typically in 2–4 weeks depending on data quality and scope.
Yes. We integrate and model data without forcing system changes; we focus on the analytics layer.
We'll connect your sources and deliver a baseline dashboard, then iterate with your team.